Can I monitor hardware OOTB with #vROps?
 So very recently i had a great question from a customer regarding ways to monitor things like the temperature of host systems. Would they need a management pack or is this something vROps can do out of the box?
The short answer to this is yes, but it is not immediately obvious how.
There are a great many metrics that come with a vanilla build of vROps but not all of them are enabled a good example of these are the sensor metrics.
To find the metrics you have enabled or disabled in your vROps deployment you will need to go to policies and edit the policy pertinent to your environment.
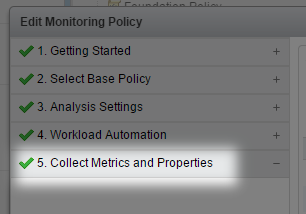
In the left hand menu choose “Collect Metrics and Properties” as shown in the example below.

Then in the main window do a search for using the key word Sensor as shown below.

You can see that the “state” is inherited from the default policy and the metrics are all disabled.
You can choose to edit the state directly per metric (as shown below), or click actions and set the state for all the metrics you have selected.

Make sure you click save before exiting your policy.
All you need to then do is wait 5 or so minutes for the first sets of data to appear.
Naturally you can use this to disable the collection of certain metrics as well.

