Getting started with vRealize Log Insight 4.3 for vRealize Automation 7
 In this humble consultant’s opinion, Log Insight is one of the most useful tools in the administrator’s tool belt for troubleshooting vRealize Automation. I have lost count of the number of times I’ve been asked to help troubleshoot an issue that, when asked, people don’t know which log they should be looking at. The simple fact is that vRealize Automation has a lot of log files. Correlating these log sources to provide an overall picture is a painful, manual process - unless you have Log Insight!
Installing the Content Packs
In order to get the full picture of what’s going on during a vRA deployment you will likely need to correlate logs from vRA, vRO and NSX. Installing and configuring these is pretty easy.
I am going to assume the vSphere integration has already been configured, and all ESXi hosts are forwarding their logs to Log Insight already.
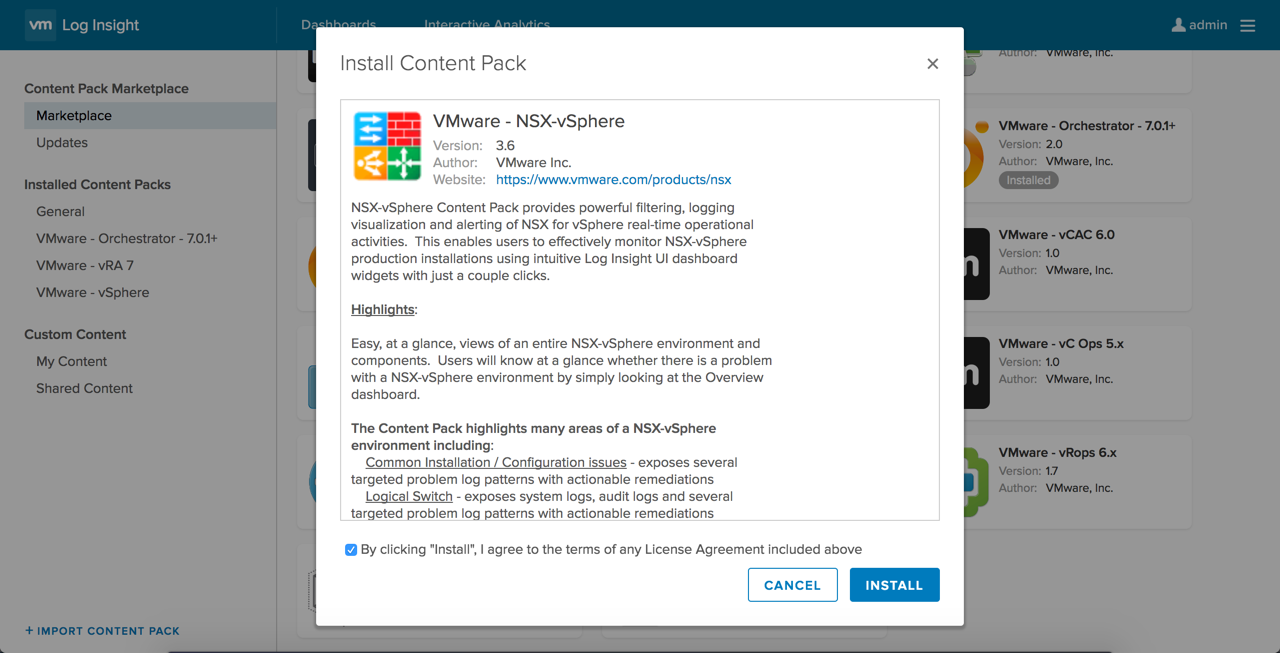
Install NSX Content Pack
Once the NSX CP is installed, configure the syslogging for the Manager, Controllers and any Edges/DLRs that are involved with vRA.
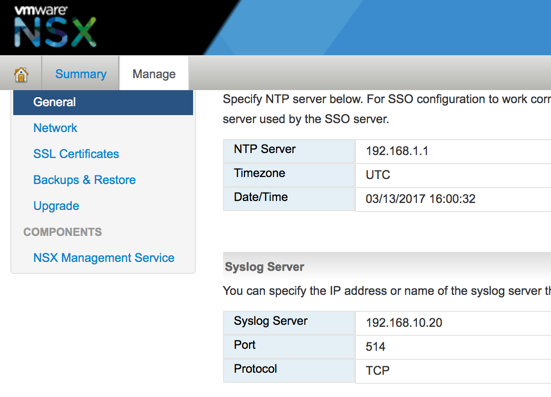
For the manager, log onto the administration web page and click Manage, General and edit the Syslog server settings.
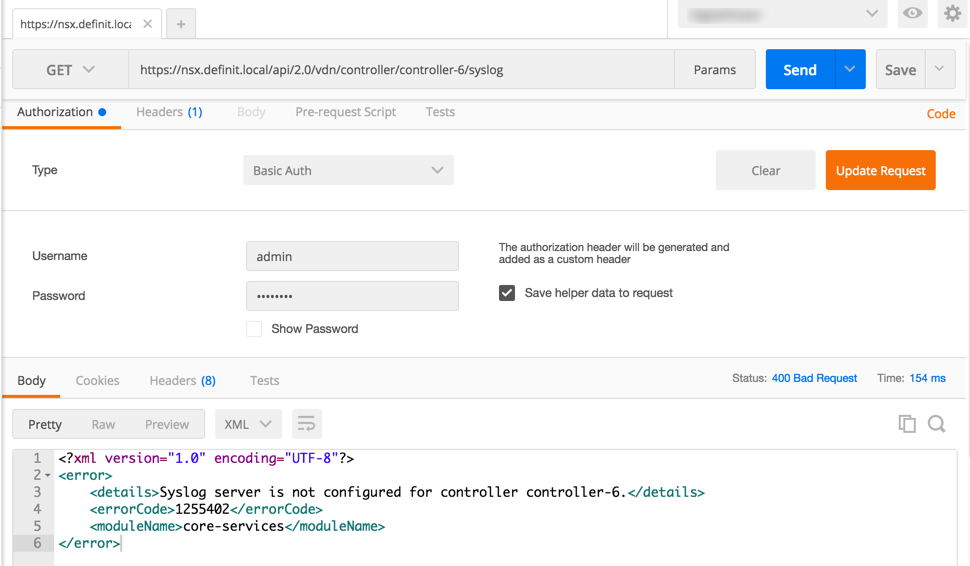
At the time of writing the Controllers can only be set via the API - so open you favourite REST client (I like Postman) and update the config with a POST (see https://kb.vmware.com/selfservice/microsites/search.do?language=en_US&cmd=displayKC&externalId=2092228). Remember that you need to do it for all 3 Controllers in the cluster.
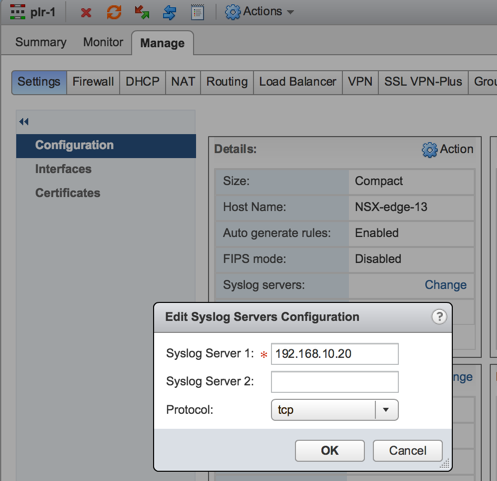
Updating the Edge and DLR config is done from the NSX Network and Security plugin within the vSphere Web Client - edit the Syslog Servers for Edge or DLR and under Settings > Configuration.
Install vRealize Orchestrator Content Pack
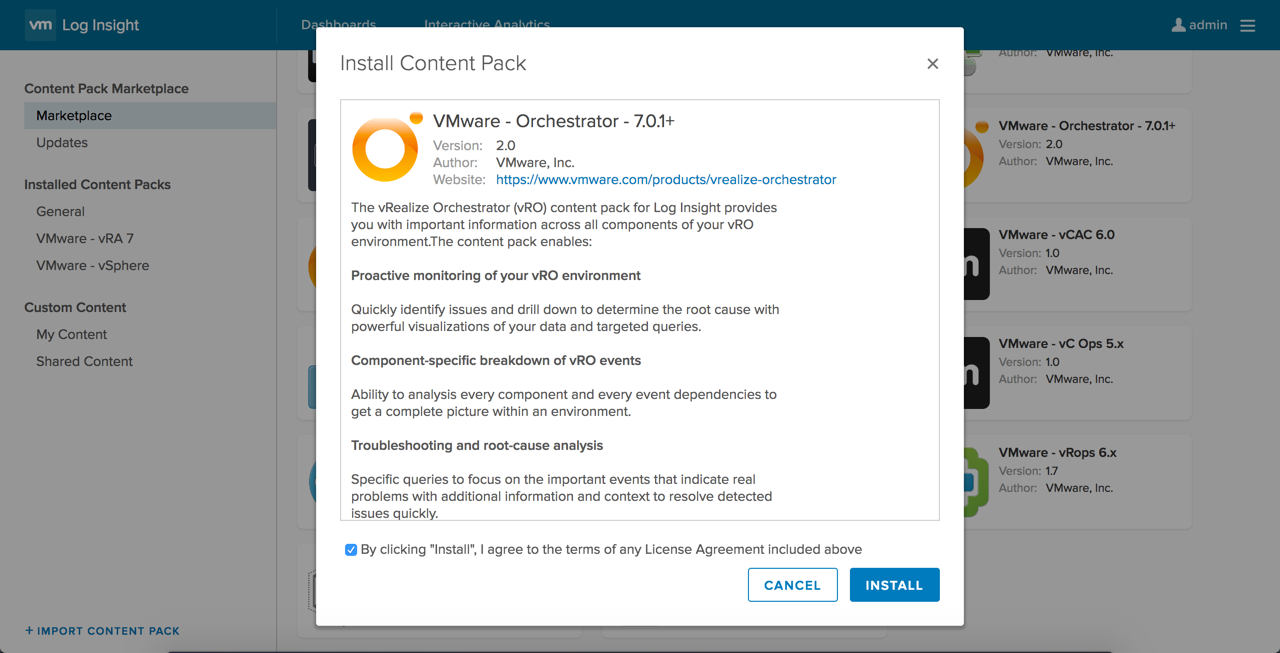
Once the Orchestrator Content Pack is installed we need to configure vRealize Orchestrator to use the CFAPI protocol to send logs to Log Insight, and configure the template for vRealize Orchestrator.
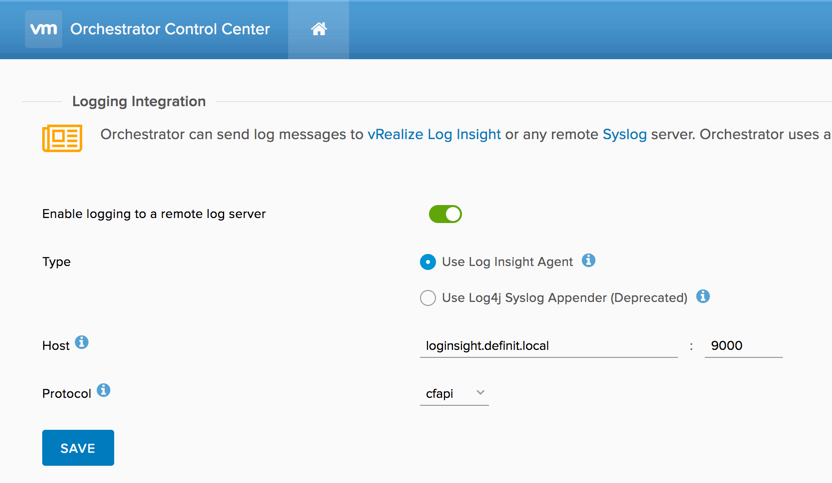
Log onto the vRealize Orchestrator control center and edit the Logging Integration. Configure logging to use the Log Insight agent and the cfapi protocol.
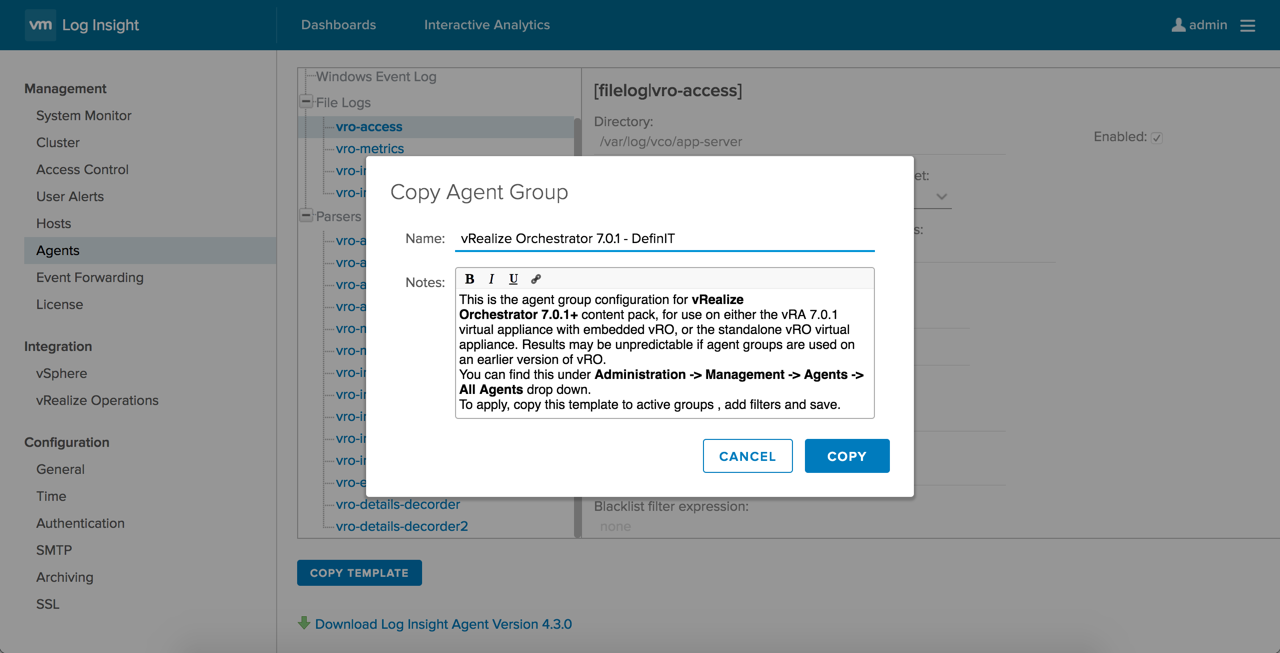
Finally, open the Log Insight administration console and go to the Agents page. Select the vRealize Orchestrator template from the drop down and copy the agent group. Then configure the filter to include your vRealize Orchestrator server(s) - in my lab I am configuring the on-board Orchestrator on my vRealize Automation appliance (vra.definit.local) and a stand-alone Orchestrator appliance (vro.definit.local). Scroll to the bottom and save the new Agent Group.
After a few minutes you should see data from the Orchestrator instances begin to populate the dashboard

Install vRealize Automation Content Pack
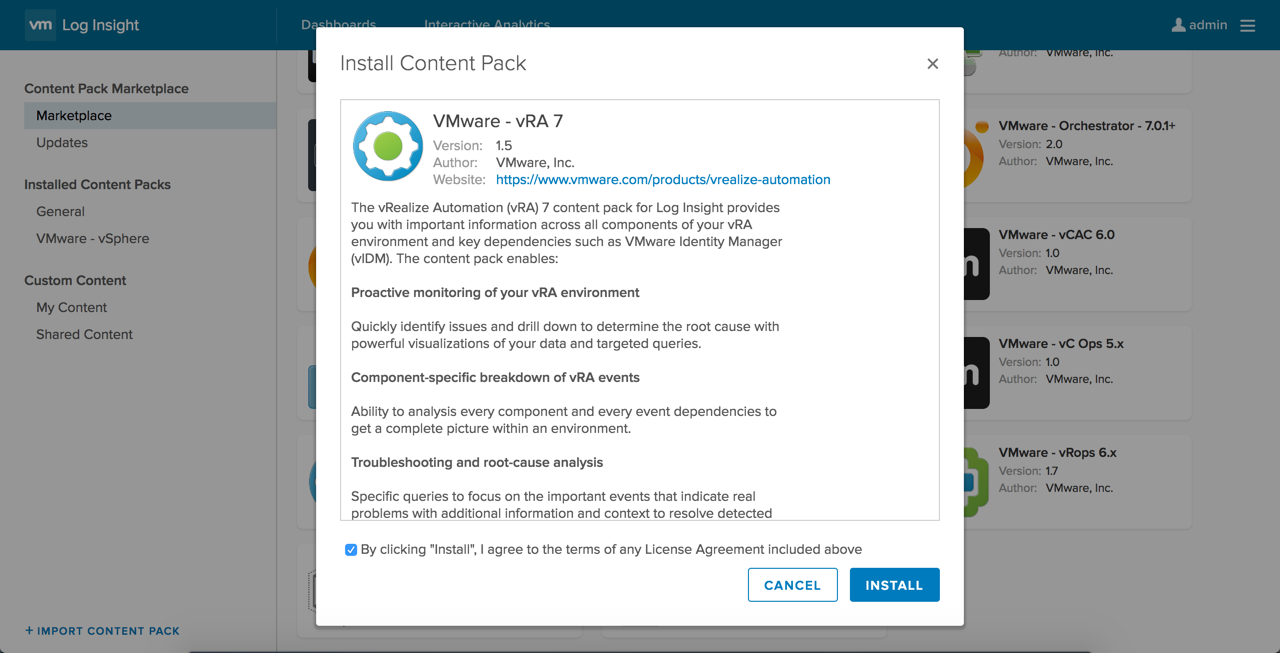
Now the two pre-requisite Content Packs are configured we can install the vRealize Automation Content Pack.
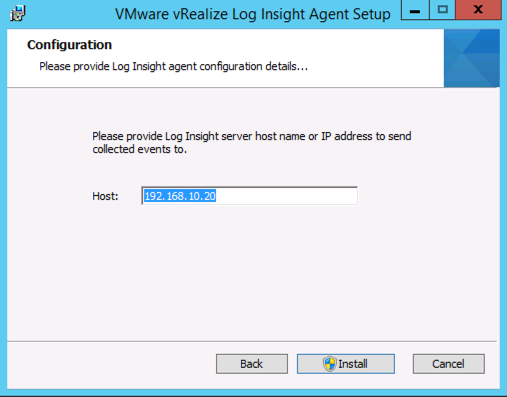
Firstly, install the Log Insight agent onto the Windows IaaS servers (download from the Agents page, or https://loginsight/admin/agents?downloadAgentMSI=true). The only input required is the IP/hostname of Log Insight.

Duplicate the"vRealize Automation 7 - Linux" and “vRealize Automation 7 - Windows” Agent templates, and filter to include the relevant vRealize Automation components for each. For this lab I only have a single appliance and IaaS server - make sure you include all components for a distributed install.
Data should now begin populating the vRealize Automation 7 dashboards.
Following a vRealize Automation blueprint deployment in Log Insight
Now the content packs are all configured, and log data is flowing into Log Insight, I can trace an end-to-end blueprint deployment from vRealize Automation. I will use a demo template that I have configured - “2-tier application with load balancer”, which includes two Linux VMs (web and db), some NSX components (logical switches, load balancers) and some software components (apache and mysql install).
This is the request, now in progress - you can see that the request is #34:

From Log Insight under the vRealize Automation dashboards, I can select the vRA Catalog requests, and see that request 34 has started logging events, and from a range of components.

By clicking on the bar for request 34, I can move to interactive analytics of the related events
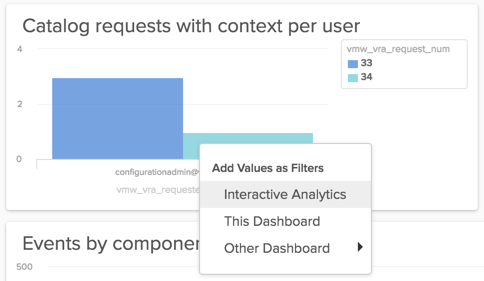
This takes you to analysis of the logs with a fairly tight filter, and we can glean a really important bit of information - the Context ID. With the context ID we can find all the related events:

The filters now look even more restrictive, but include a search for the Context string.
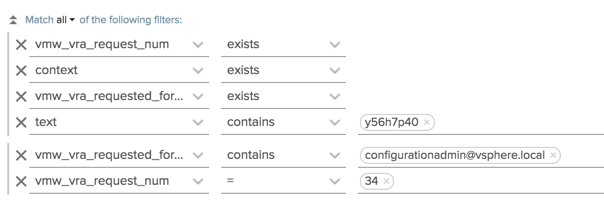
I then widen the search by removing the other filter criteria, and speed it up slightly by changing the “text contains” filter to “context equals”. This now shows me hundreds and hundreds of logged events that are from the context of this deployment, and I can literally walk through the steps that vRA has taken to build the blueprint.

As you can see, by digging into Log Insight and the context of the vRA deployment you can follow along, and if necessary troubleshoot, each step of the way. I’ve barely scratched the surface of Log Insight’s capabilities, but as soon as you start using it, it becomes an indispensable tool.


