Whats new in #vROps 6.3 part 2
In this post I will drill down to look at some of the enhancements, improvements and or new additions one by one.
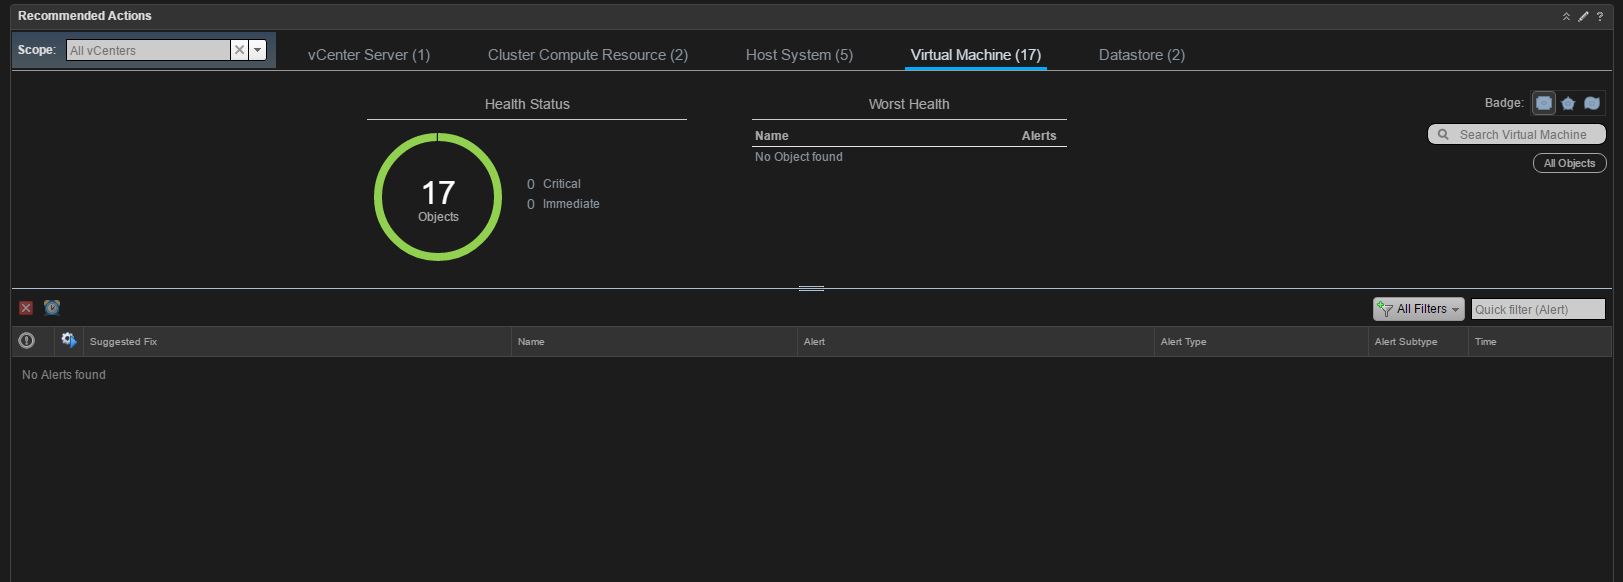
New Home Dashboard - as you can see this is a very useful and helpful way or presenting a high level set of data about your environment with also many ways to interact and interrogate the data you are being presented with. Among other items you can filter on (Health/Risk/Efficiency), alter the scope, see alerts relative to the objects you are interested in.
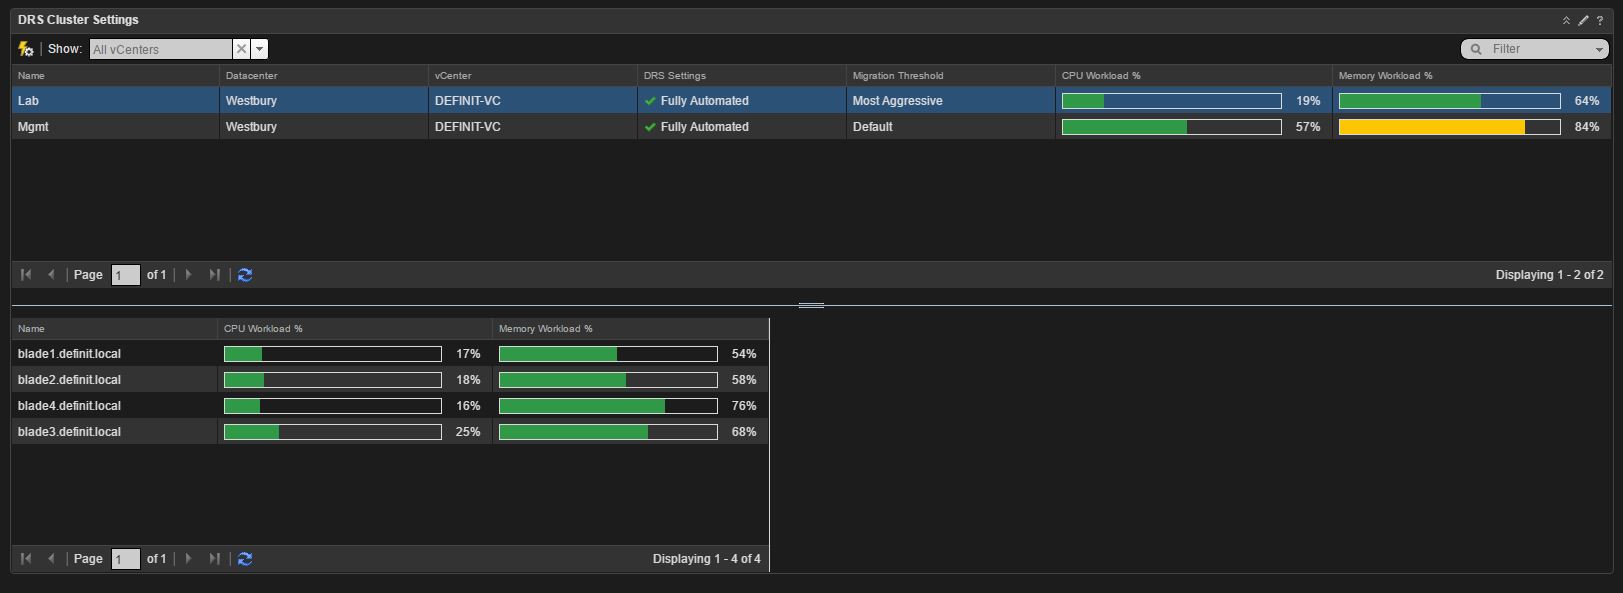
**Workload Balance & DRS **- TO further enhance the integration for the Workload placement engine this new dashboard lets you see your clusters and respective hosts and also allows you to set the DRS level per cluster.
Workload Balance - This has been enhanced from the previous version allowing you to filter by CPU/Memory only demand and also the ability to re-balance with vROps actions.
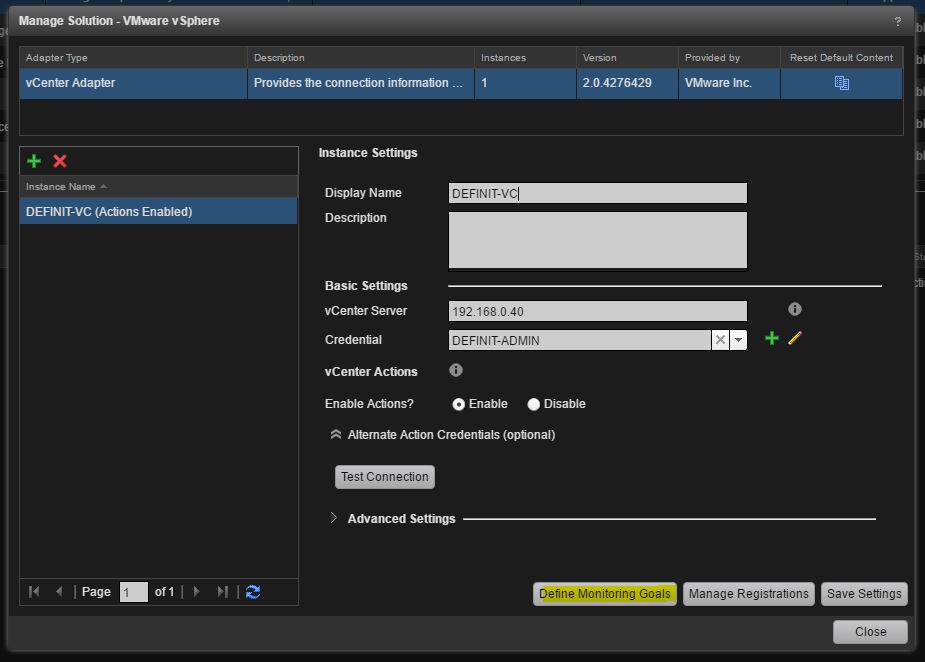
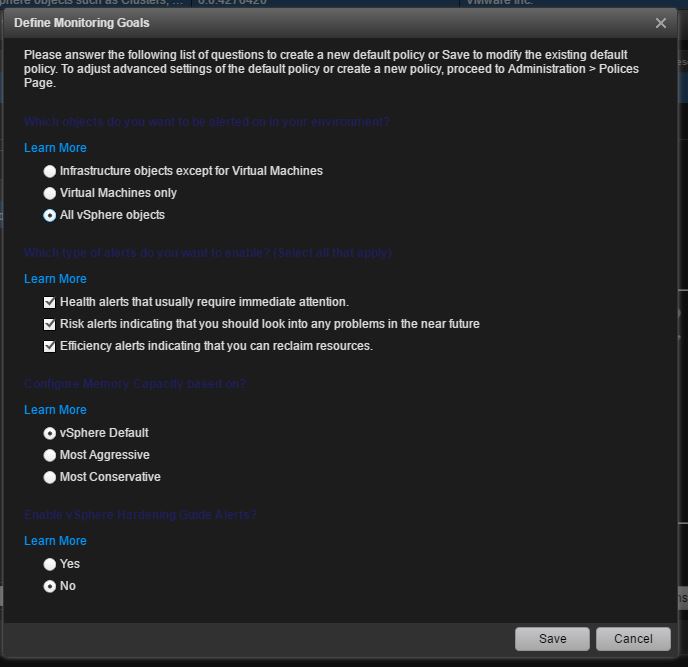
Monitoring goals - Now this has been asked for by many user and customers, this allows you to recreate a default monitoring policy by answering the questionnaire.
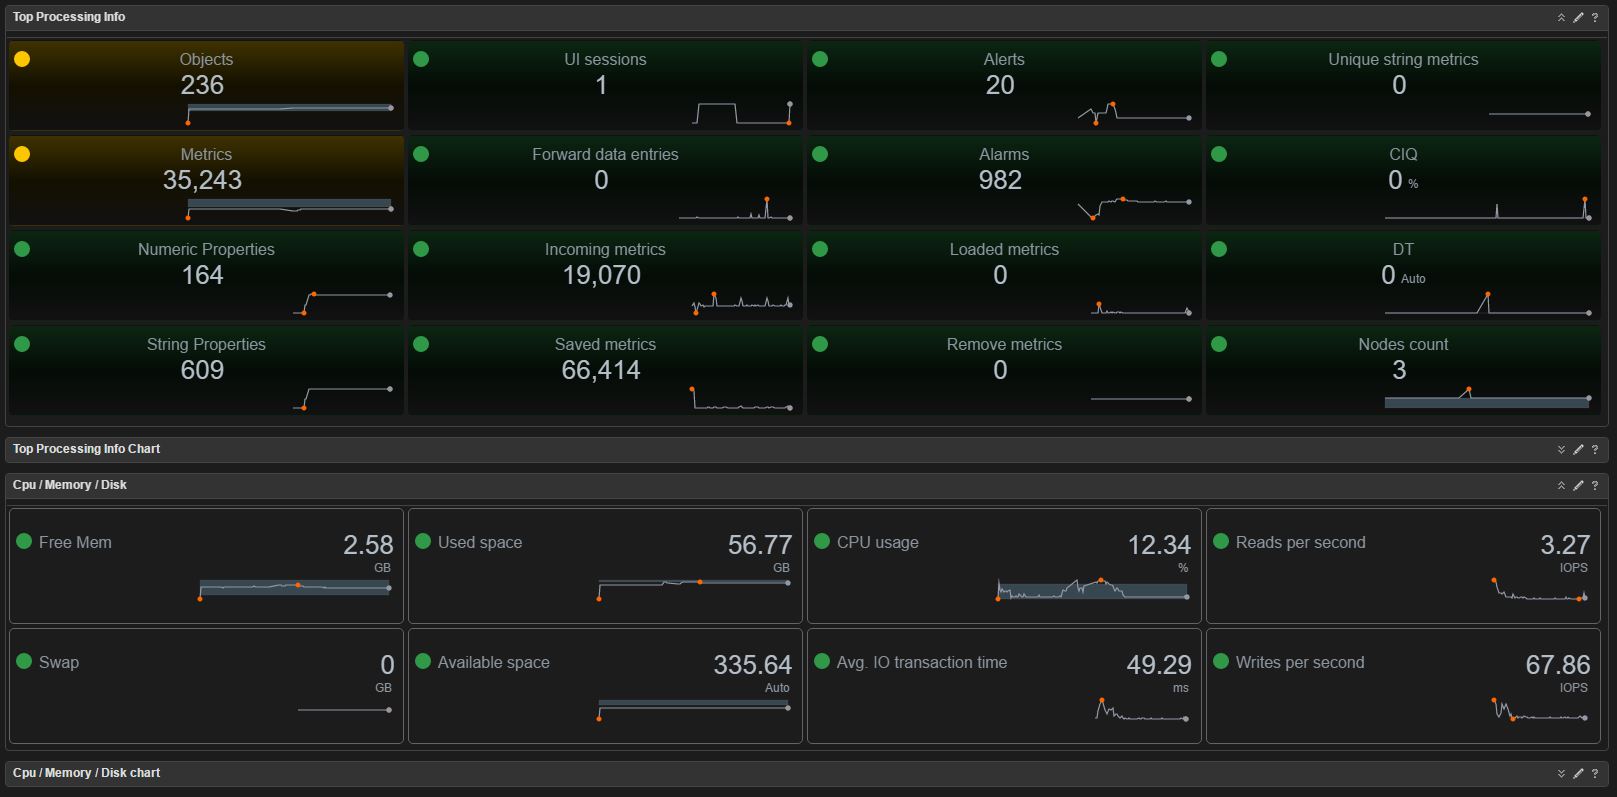
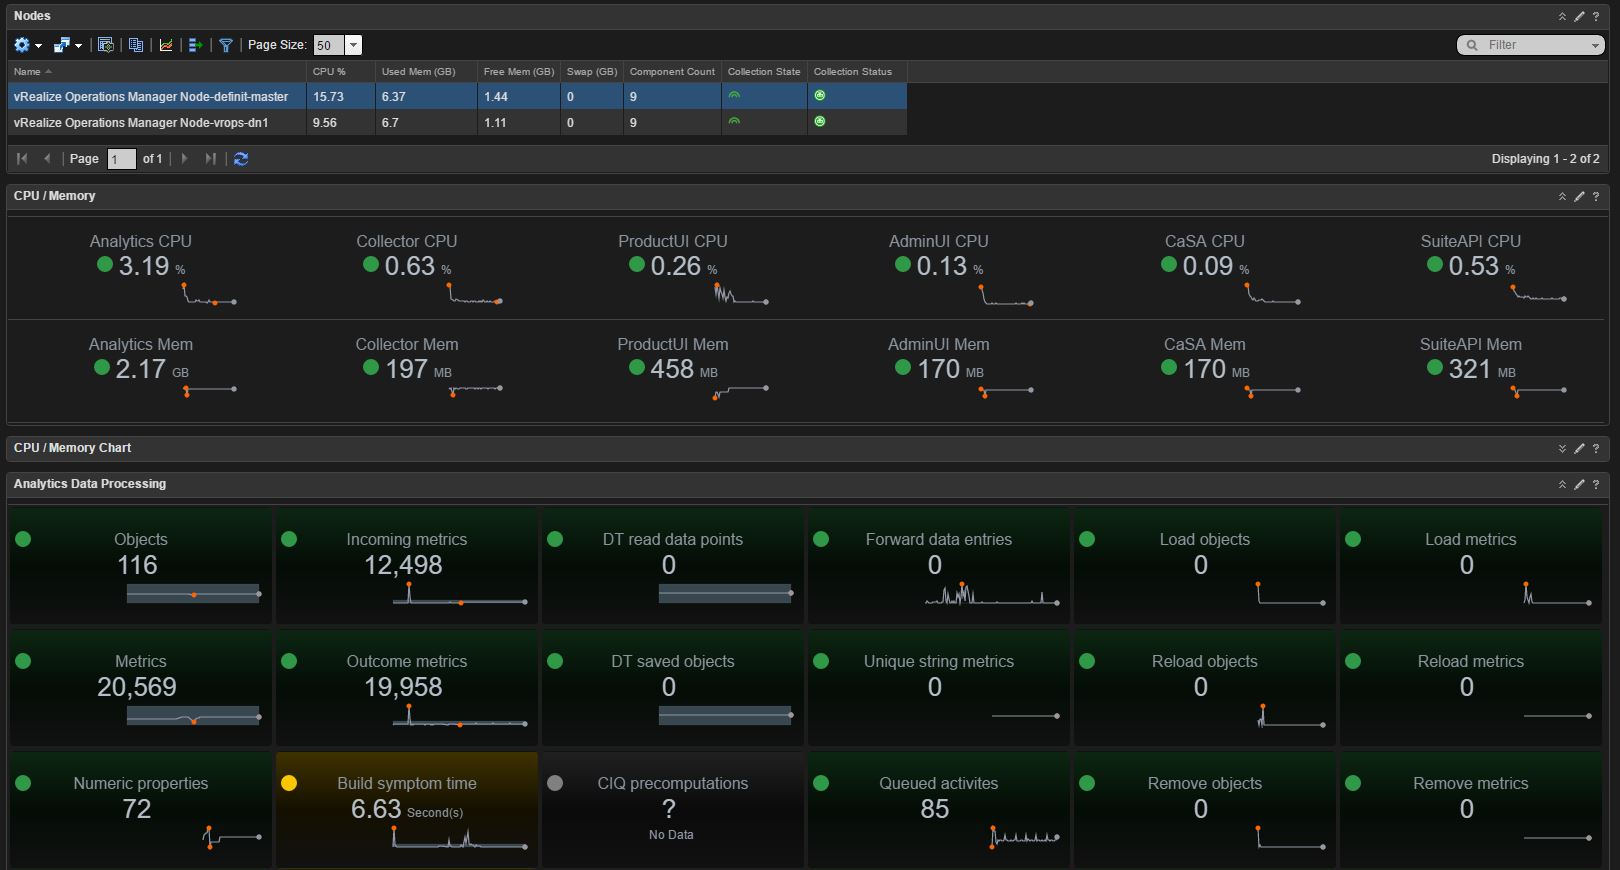
vROps Self Services Dashboards - This was another request from many customers and users alike who wanted to be able to effectively monitor vROps with this set of dashboards your wish has been granted.
