What if I want full metrics? in #vROps
 If you have used vCOps (previous version of vROPs) you will likely remember the option in the admin panel where you could change the number of metrics being collected from “balanced” to “full”.
As many found, this option drop down was not present in vROps and there appeared to be no replacement.
Here is the good news, the ability to collect those metrics has not been removed rather it’s just a little more hidden (by design)
So how do we enable “full” metrics?
The answer is policies! so before you start a quick word of caution, if you plan to modify the default policy don’t rather clone it and then carry out your changes. Better still create a new policy and have it applied to a custom group against a few objects that you are keen to have full metrics collected against.
A good example I came across recently was the lack of visibility of vSphere host hardware objects. When you check in vSphere/Hardware Status there are all manner of useful bits of information that you may wish to monitor and see in vROps and OOTB they are not enabled.
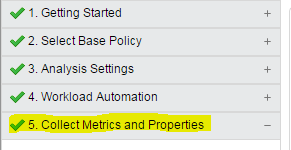
Click edit on the policy you wish to modify.Click option “5. Collect Metrics and Properties” from the left hand menu

You now have a few options on how you can proceed remember in this instance I am interested in getting host hardware information “enabled”
Click “Object type”, expand “vCenter Adapter” and select “Host System”[
 ]3
]3
Click “actions” and select all
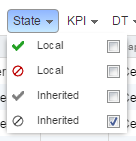
Click state and untick the top three options

Click page size and select 250
You will now have listed in one long page all of the metrics that are currently disabled that can be captured from a host system.
To narrow things down in the search box type “fan”, you will then see two metrics listed which you can enable as shown in the image.
 Once done click save in the bottom right corner and voila you have a policy that will now give you the fan metrics for a host system.
You can elect to enable a lot more but remember this will put greater pressure on your vROps cluster so choose wisely!

