Deploying fully distributed vRealize Automation instance – Configuring NetScaler Monitors
- Deploying fully distributed vRealize Automation instance – Configuring NetScaler Monitors
- Deploying fully distributed vRealize Automation IaaS components – Part 2: Database, Web and Manager services
- Deploying fully distributed vRealize Automation IaaS components – Part 1: Pre-requisites
- Deploying vRealize Automation 6.2 Appliance Cluster with Postgres Replication
- vSphere 6 HA SSO (PSC) with NetScaler VPX Load Balancer for vRealize Automation
- vCAC 6.0/6.1 build out to distributed model: Deploy the Identity Appliance
![]()
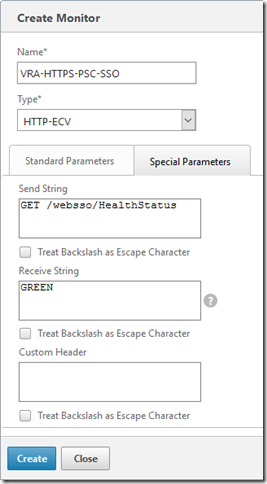
Enter a name for the monitor, and leave the other parameters the same. Select the “Special Parameters” tab and configure the send string to the URL to monitor - e.g for the PSC SSO it’s going to be:
GET /websso/HealthStatus
For the receive string, enter the expected response (“GREEN”). Click Create.
Assigning a NetScaler Monitor to a Service
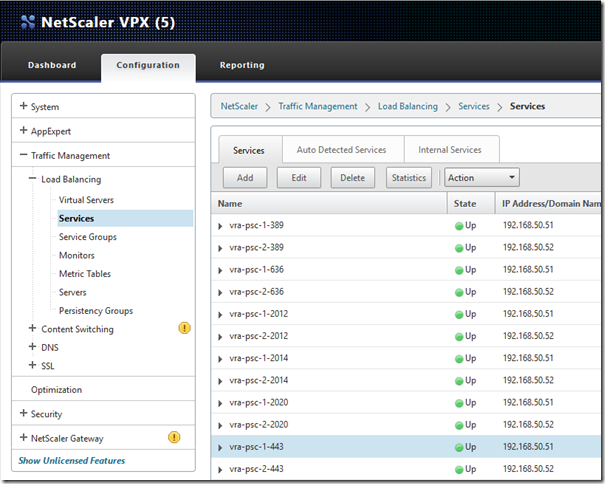
Assign the monitor to the PSC Services (or Service Groups) configured for PSC by opening the Configuration > Traffic Management > Load Balancing > Services page and selecting the PSC service for HTTPS/443 and clicking Edit.
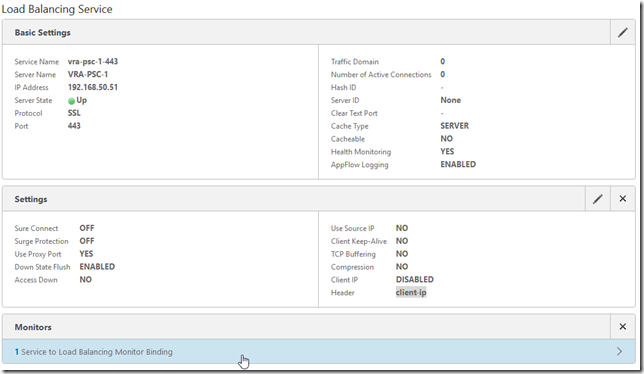
Click on “1 Service to Load Balancing Monitor Binding” under Monitors
You can see the default TCP connection monitor. Click “Add Binding”

Click the “Select Monitor” box and select the monitor that was created for this service (e.g. VRA-HTTPS-PSC-SSO) and then click Bind.
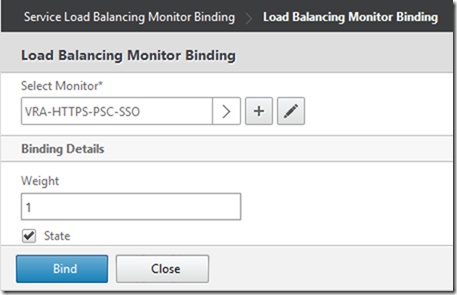
All being well, you should now see the new monitor bound and with a state of “Up” - the last response should be a success.

Repeat this for each Service or Service group you need to configure that monitor for.
vRealize Automation Load Balancer Monitors
The following monitors can be used for a distributed vRealize Automation installation.
vSphere 6 PSC (SSO) Monitor
The status of the SSO service on each PSC node can be monitored using the following address:
https://<psc-node-fqdn>/websso/HealthStatus
As you can see below, the desired response is “GREEN”.

vRealize Appliance (cafe) Monitor
The status of the Cafe service on each vRealize Appliance can be monitored using the following address:
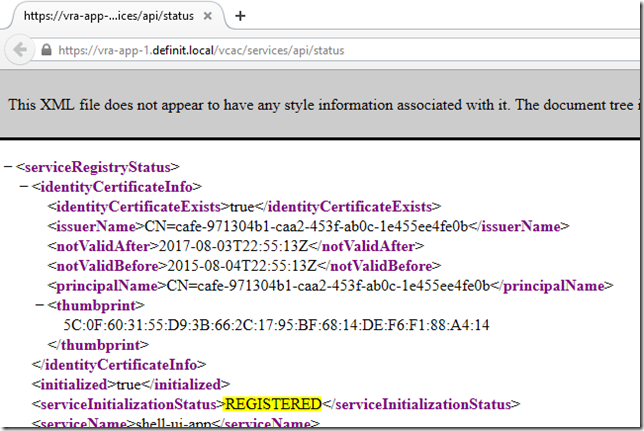
https://<vra-appliance-node>/vcac/services/api/status
The desired response is “REGISTERED”
Warning: In the case of all vRealize Appliances being shut down, this load balancer configuration will cause the appliances to fail on start-up unless you add the load balancer URL to the /etc/hosts file or temporarily change the monitor back to tcp-default. This is because start-up process refers to the services based on the load balanced URL - which won’t be available until at least one appliance has initialised. Rebooting one appliance at a time will be fine. Thanks to Carl Prahl, Gregg Robertson and Omer Kushmaro for help working this out!
Be sure to add the line outside of the “# VAMI_EDIT” section, otherwise it will not persist past the next reboot.

vRealize IaaS Web Monitor
The status of the Web service on each vRealize IaaS Web role can be monitored using the following address:
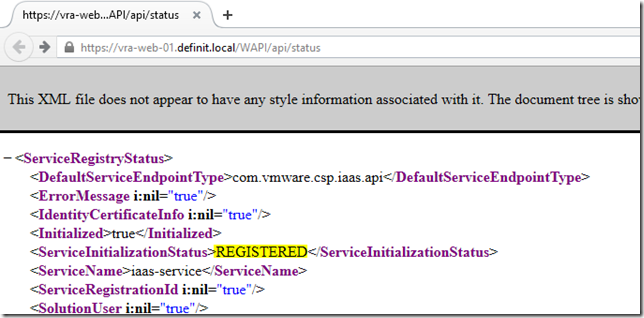
https://<vra-iaas-web-server>/WAPI/api/status
The desired response is “REGISTERED”
vRealize IaaS Manager Monitor
The status of the Web service on each vRealize IaaS Web role can be monitored using the following address:
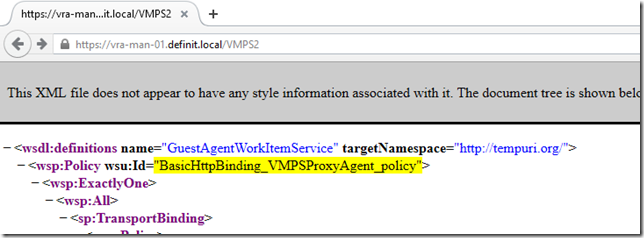
https://<vra-iaas-manager-server>/VMPS2
The desired response is “BasicHttpBinding_VMPSProxyAgent_policy”
